

We published 53 AI-written blogs on our own site in ten weeks. Then we left them alone for 90 days and measured what happened.
The result was not the hockey stick anyone wants to post about. It was more useful than that.
Clicks went up 47 percent. Average position improved by 24 places. Impressions went down. Blog pages now generate three quarters of our search impressions and almost none of our clicks.
Here is the full read, including the parts that did not work.
The Setup, Exactly as It Ran
No hidden variables. Here is what we did.
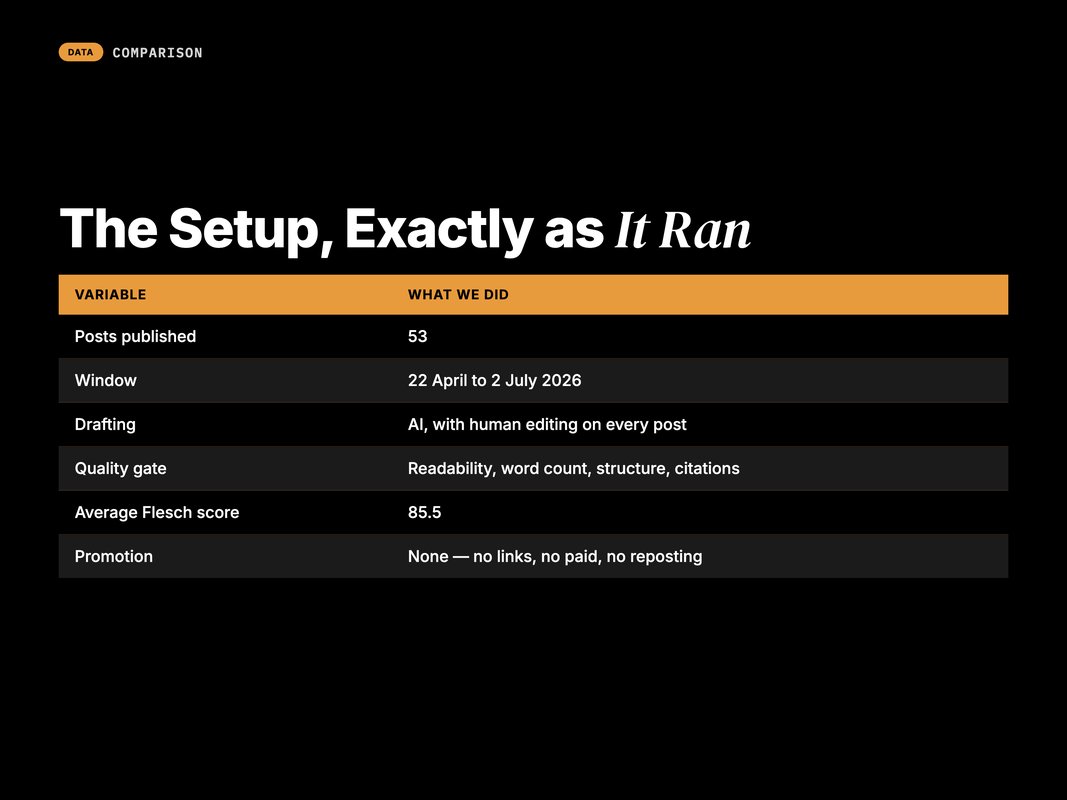
Between 22 April and 2 July 2026, we published 53 blog posts to yardagency.ai. Every one was drafted by AI, edited by a human, and pushed through a validator before it went live.
The validator was not optional. Each post had to clear four gates before it could publish. A readability floor, a word-count range, a structure check and a citation check.
The published set averaged a Flesch reading ease of 85.5. That is deliberately high. Short sentences, plain words.
Topics were split across six content pillars. AI news, platform intel, industry playbooks, our own methods, results, and team.
Cadence was roughly five to six posts a week. Two a day on some days, which is faster than most teams should attempt.
Each post also shipped with a cover image and four to six inline graphics. That mattered less than we expected, which is its own small finding.
Then we stopped. No link building. No paid promotion. No republishing. We wanted to see what the content alone would do.
That restraint is the point of the test. Plenty of published case studies quietly run paid promotion alongside the content and then credit the content.
It also makes the result a floor, not a ceiling. Whatever the pages did here, they did without help.
Q: Was any of it fully automated?
A: No. Drafting and image generation were automated. Editing, fact-checking and the publish decision were human. Every stat in every post had to carry a live source.
What the Numbers Actually Say
We compared two 90-day windows in Google Search Console, on the yardagency.ai domain property.
The before window ran 11 February to 11 May 2026. The after window ran 12 May to 9 August 2026 (Source: Google Search Console, yardagency.ai domain property, measured 9 August 2026).
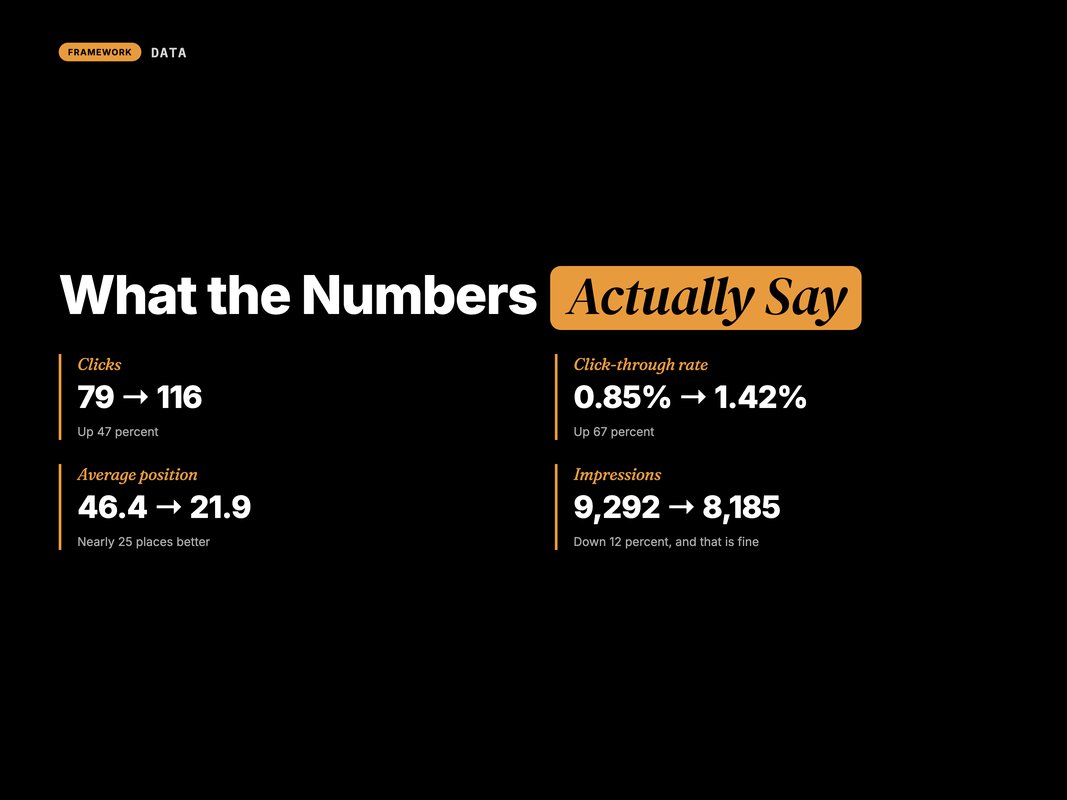
Four numbers moved.
Clicks rose from 79 to 116. That is a 47 percent increase.
Click-through rate rose from 0.85 percent to 1.42 percent. A 67 percent improvement, and the healthiest signal in the set.
Average position improved from 46.4 to 21.9. That is a gain of nearly 25 places.
Impressions fell from 9,292 to 8,185. Down about 12 percent.
That last one looks like a failure. It is not, and the reason matters.
At position 46, you appear for a huge spread of queries and are relevant to almost none of them. At position 22, you appear for fewer queries and are actually about them.
Impression counts reward being vaguely present. They punish getting specific. That makes them a poor headline metric for any content programme.
Watch position and CTR instead. They move in the direction the business cares about.
We traded a wide pile of worthless impressions for a narrower pile of real ones. The rising CTR is the proof.
Q: Are these small numbers?
A: Yes, in absolute terms. It is a young site in a competitive category. The percentages and the position shift are the signal, not the totals.
The Uncomfortable Finding
Now the part most case studies leave out.
In the after window, 53 blog URLs earned impressions. Those pages produced 6,124 impressions, about three quarters of everything the site earned.
They produced 14 clicks.
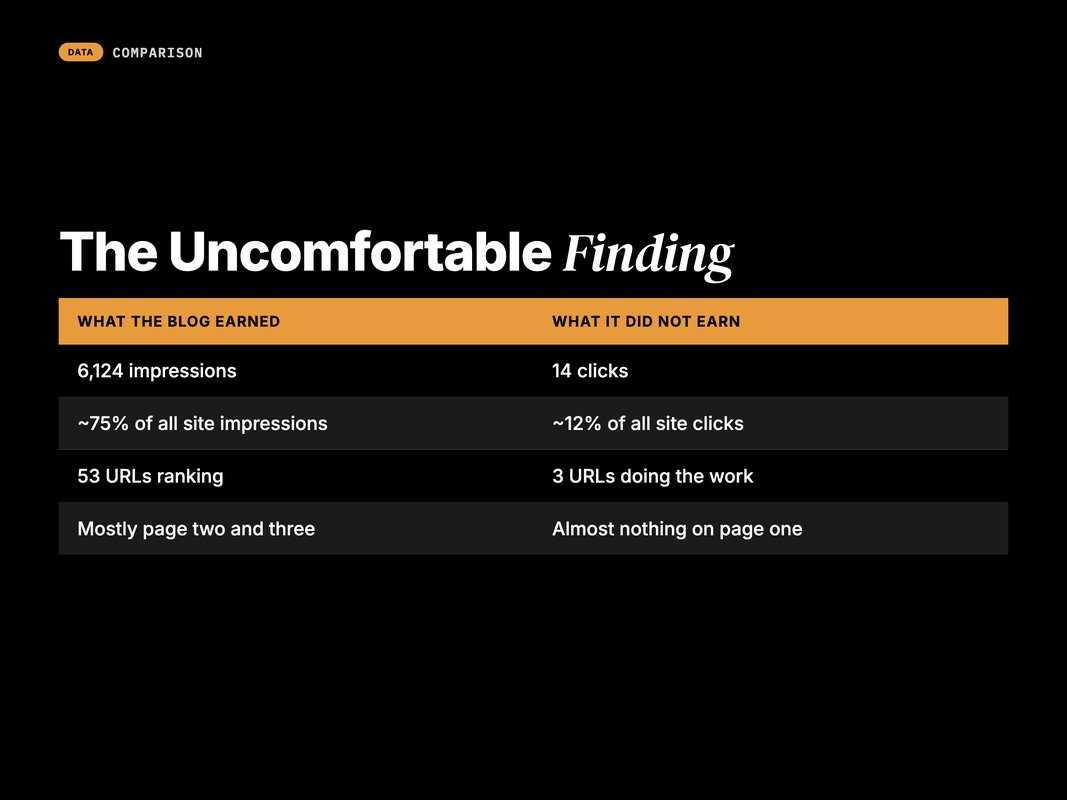
That is a blog click-through rate of roughly 0.23 percent. It is bad, and it is entirely explainable.
Almost all of those pages sit on page two or three. Nobody clicks page three. The impressions are real, the visibility is real, and the traffic is not.
A handful of pages did break through. Our best performers landed around position 7.7, 9.6 and 11.1 with roughly 750 impressions each.
Even those are instructive. A page at position 7.7 with 762 impressions returned 4 clicks in 90 days.
That is what page one looks like at the bottom of page one. The gap between position 8 and position 3 is far bigger than the gap between position 40 and position 8.
Those are the pages earning nearly all the blog clicks. Three pages out of 53.
That distribution is the lesson. Volume produced a long tail of page-two rankings and a very short head of page-one ones.
Look at what the three winners had in common. Each covered a specific, named thing people search for by name. A tool. A platform update. A named algorithm.
The losers were broader. Category explainers on topics with a hundred stronger pages already ranking.
We did not need better writing on those pages. We needed different topics.
Q: So did the volume work?
A: It worked for discovery. It did not work for traffic. Those are different outcomes and we conflated them at the start.
Why This Matches the Wider Research
Our result is not unusual. It lines up with what other studies found in the same period.
Rankability scored 487 top-ranking Google results for competitive commercial keywords. It found 83% of them read as human-written, not AI-generated (Source: Rankability, 2026 — rankability.com).
Rankability calls it a small, directional sample. Read it as a signal, not proof.
Case study reviews reach a similar conclusion. Edited AI content on an established site tends to hold its rankings. Bulk AI-only content on a new domain gets a short visibility test and then fades (Source: Arvow, 2026 — arvow.com).
Put our data next to that and the picture is consistent.
The pattern holds across site size. New domains get tested and dropped. Established domains hold. Ours sits in between, which is why we landed on page two rather than either extreme.
That is worth knowing before you plan a volume push. Your domain's existing authority sets the ceiling for what volume alone can achieve.
AI content gets you into the index and onto page two reliably. Getting to position one is a different job, and volume is not the tool for it.
What We Would Do Differently
Same effort, spent differently. Here is the revised plan.
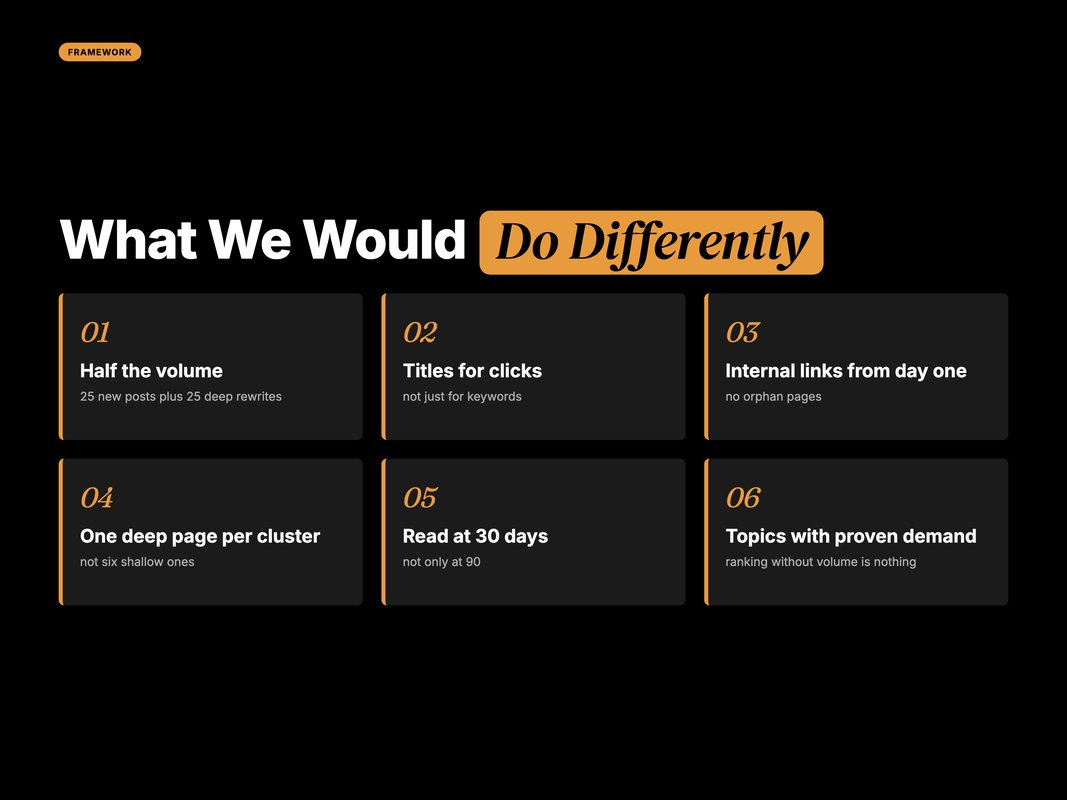
Half the volume, half the effort into rewrites. Twenty-five new posts and twenty-five deep rewrites beats fifty-three new ones. The rewrites go to pages already sitting between position 8 and 20, where small gains produce real clicks.
Titles built for clicks, not just keywords. At position 11 with a dull title you get nothing. At position 11 with a title someone wants to open, you get a trickle. That trickle compounds.
Internal links from day one. We published 53 orphan-ish pages and linked them lightly. A tight internal mesh would have moved the weakest pages several places on its own.
One deep page per cluster, not six shallow ones. Six posts circling a topic split the signal. One thorough page plus five supporting posts pointing at it does not.
Measure at 30 and 90 days, not once. We checked at the end. A 30-day read would have told us the CTR problem existed while we could still change the plan.
Pick topics with proven demand. Several posts ranked instantly and earned nothing, because nobody searches for them. Ranking first for a query with no volume is not a win.
The cheapest fix in that list is the title work. It costs an hour per page and it applies to pages that already rank.
Q: Does this mean stop using AI for content?
A: No. It means stop treating publish volume as the goal. The drafting speed is real and useful. The strategy around it has to be sharper than "more".
The Honest Cost Accounting
Volume is cheap to produce and not free to own.
The bill arrives later and in a different currency. Not money. Attention.
Every published page needs someone to remember it exists.
Every published page needs monitoring, occasional updating and an internal link plan. Fifty-three pages is a real maintenance surface.
There is a quality tax too. Somebody has to fact-check every statistic and verify every source link. On our posts that was the slowest step by a distance, and it is the step you cannot skip.
We also spent time on things that produced nothing. Posts on topics with no search demand ranked instantly and got zero impressions, because nobody was looking.
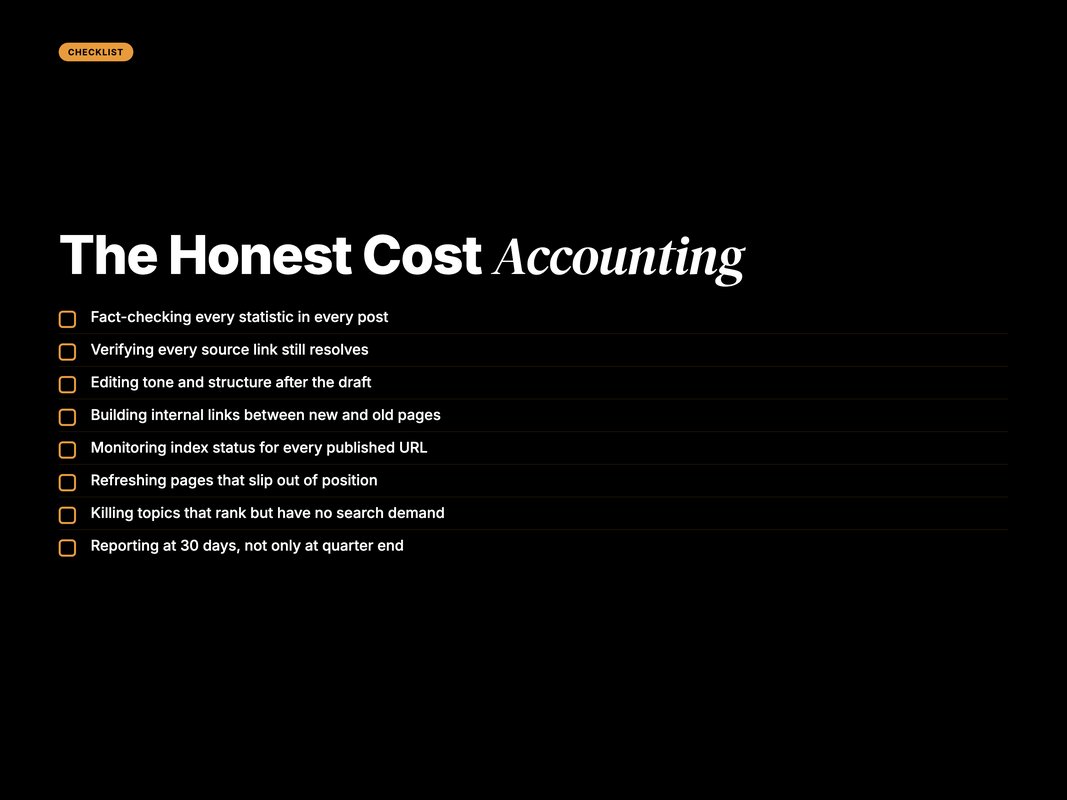
The drafting was never the bottleneck. Editing, verification and distribution were. Those scale with human hours, not with model speed.
Put a number on it before you plan. In our run, drafting was a small share of total effort. Verification, editing and publishing took the rest.
So a plan that doubles output has to double that human capacity too. Most plans quietly assume it will not need to.
That is the real constraint on AI content. Not whether the model can write. Whether your team can stand behind what it wrote.
How We Run This For Clients Now
We ran this experiment on our own site precisely so we could stop guessing on client ones.
There is a reason we published the bad numbers as well as the good ones. Anyone can show a chart going up. The useful question for a client is what the failure modes look like, and how fast you can see them coming.
YARD is an AI-first growth marketing agency. We run performance marketing, LLM SEO, AI creative and AI funnels for D2C and B2B brands. Content is one part of that, and it is now run against this data.
Three rules came out of it.
We split every content budget between new pages and improvement work. A plan that is 100 percent new posts is a plan that will produce page-two rankings and not much else.
We report position bands, not just totals. Pages in the 8 to 20 range are the priority list, because that is where effort converts to clicks fastest.
And we read at 30 days. A content programme that has not been checked until quarter end has already wasted a quarter of its budget.
If you are publishing steadily and traffic is not moving, the fix is usually not more posts. It is depth, links and titles on the pages you already have. For the pipeline behind this, see How to Build an Automated Blog Pipeline with Claude + Airtable.
The Short Version
We published 53 AI-written blogs in ten weeks and measured 90 days of results.
Clicks rose 47 percent. Click-through rate rose 67 percent. Average position improved from 46.4 to 21.9. Impressions fell 12 percent, and that fall was a good thing.
The uncomfortable part: those 53 pages produced three quarters of our impressions and 14 clicks. Page two does not pay.
Three pages did the work. Everything else built coverage.
Coverage still has value. It is what makes the next quarter's rewrites possible, because you cannot improve a page you never published.
But do not mistake coverage for traffic. They arrive on very different timelines.
So the next 90 days is not another 53 posts. It is rewrites on the pages sitting between position 8 and 20, better titles. An internal link mesh that should have existed from the start.
Want the same measured read on your content programme? Talk to the YARD team and bring 90 days of Search Console access.
FAQ
Q: Does AI-written content rank on Google?
A: Yes, but rarely at the top on its own. In our data it moved us from invisible to page two and three. Industry studies show human-written pages still take position one far more often.
Q: What actually happened to our traffic?
A: Clicks rose from 79 to 116, up 47 percent. Click-through rate rose from 0.85 to 1.42 percent. Average position improved from 46.4 to 21.9. Impressions fell 12 percent.
Q: Why did impressions fall while rankings improved?
A: Because we stopped appearing weakly for a very wide set of queries. We started appearing properly for a narrower, more relevant set. Fewer, better impressions is a real outcome.
Q: Is 53 posts in 10 weeks too many?
A: For discovery, no. For traffic, it was the wrong lever. Volume bought us index coverage and ranking positions. It did not buy clicks, because page two gets very few.
Q: Would you do it again?
A: Yes, with one change. We would spend the same effort on 25 posts and 25 rewrites. Not 53 new ones. The second half of that work is where clicks come from.
Q: What is the single biggest lesson?
A: Publishing is not the finish line. Getting to page two is the easy half. Everything after that is depth, internal links and titles people want to click.
Insights from Our Experts
Explore our latest articles on digital marketing strategies.