

Your CPM chart bent upward in July. Your budget did not.
This happens most summers, so it is easy to shrug off. This July was different. Four separate changes landed inside the same month, and most accounts caught at least two of them.
The short answer: the auction got pricier, six markets picked up a new fee, your audience pools were resized. Your reports moved underneath you. Here is how to tell which one hit you.
First, the Numbers You Are Being Compared Against
Before you diagnose your account, anchor on the market.
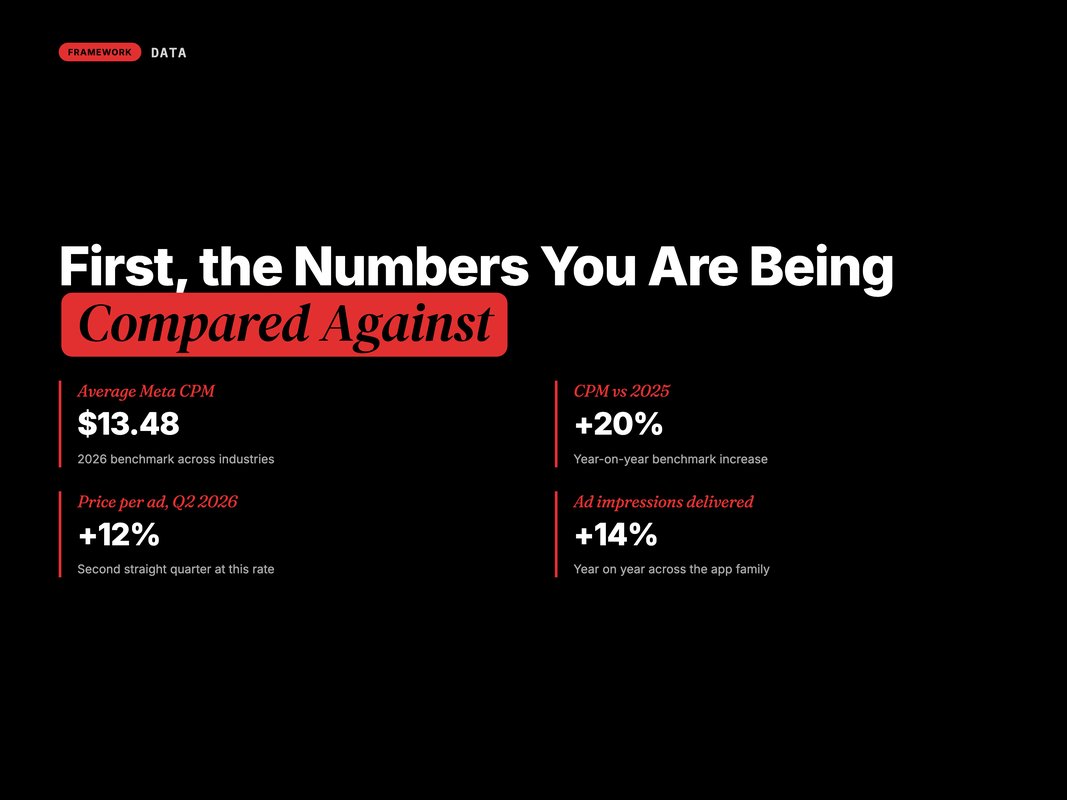
Meta CPM hit 13.48 dollars on average in 2026. That is up about 20 percent on 2025 (Source: Adamigo, 2026 — adamigo.ai).
Meta's own numbers say the same thing. Price per ad rose 12 percent year on year in Q2 2026. That was the second straight quarter at 12 percent. Ad impressions across the app family grew 14 percent (Source: Digital Applied, 2026 — digitalapplied.com).
Read those two together. Supply went up. Price went up anyway.
That is the tell of demand outpacing inventory. More advertisers, more budget, same eyeballs.
That gap is the whole story of 2026 so far. Supply is growing. Demand is growing faster. No account is exempt from that, however well it is run.
So treat a price rise as the baseline, not the crisis. The crisis is only when your results fall at the same time.
Q: Is a 12 percent rise normal?
A: It is now. Two consecutive quarters at the same rate is a trend, not a blip. Plan next year's budget with a double-digit price rise baked in.
Cause One: The Auction Got Denser
The biggest driver is not mysterious. It is concentration.
Advantage+ and its cousins pull more brands into fewer, broader auctions. When everybody targets "everyone", you all bid for the same high-intent slots (Source: Adamigo, 2026 — adamigo.ai).
Manual targeting used to spread demand across many small pools. Broad targeting folds them into one.
There is a second squeeze on top. Meta's pricing rewards engagement. Ads that people scroll past cost more to deliver than ads people stop on.
So a weak creative does not just underperform. It gets taxed.
That is why two accounts in the same category can see very different July charts. One refreshed creative in June. The other did not.
Q: Should I turn Advantage+ off to lower CPM?
A: Rarely. You usually trade a lower CPM for a worse conversion rate. Test it as a split, and judge on cost per purchase, not on CPM.
Cause Two: Six Markets Picked Up a New Fee
This one is a line item, not an auction effect. It is also the easiest to miss.
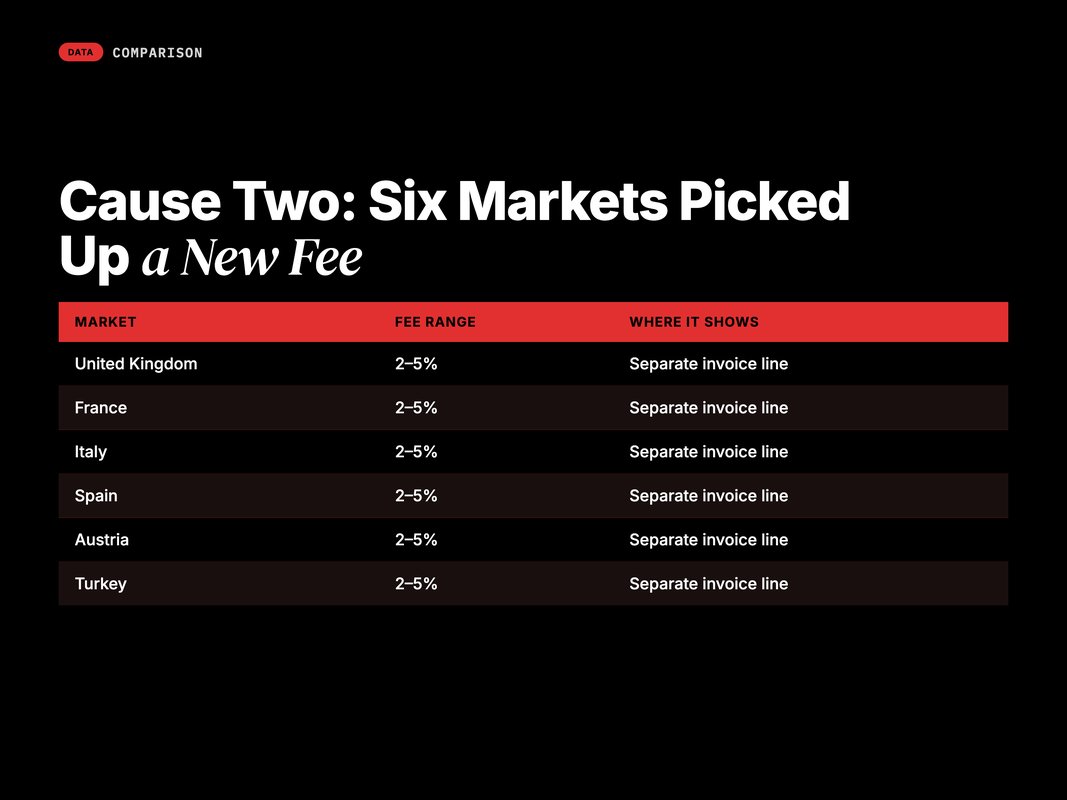
From 1 July 2026, Meta began charging fees of 2 to 5 percent on ads shown in six markets. Those are the UK, France, Italy, Spain, Austria and Turkey. The fees sit outside your budget. They show up as their own invoice line (Source: Digital Applied, 2026 — digitalapplied.com).
That matters for how you read your own numbers.
Your in-platform CPM will not show it. Your invoice will. If you pull spend from Ads Manager only, your true cost per sale looks lower than it is.
If those six markets carry most of your spend, the real rise is worse than the headline. You pay the market price rise and the new fee on top.
For an India-first or US-first account, this one does not apply. Check where your ads run before you blame it.
Q: Can I avoid the location fees?
A: Only by not advertising in those countries, which is rarely the right trade. Better to price them into your target cost per sale and keep the market.
Cause Three: Your Audiences Quietly Got Bigger
July also changed who Meta can match.
Meta retired the old off-platform opt-out. It now sits inside a broader control. People who had switched it off came back into the matchable pool (Source: Common Thread Collective, 2026 — commonthreadco.com).
The effect is audience inflation. Pools and lookalike seeds grew without you touching a setting (Source: AdBeacon, 2026 — adbeacon.com).
Bigger is not automatically better.
A retargeting audience that doubles overnight is a different audience. It now holds colder, less engaged people. Your warm campaign starts behaving like a cool one.
That shows up as a higher cost per action in a campaign you did not change. The rollout began in July across the US and about ten more markets. The EU is being handled on its own under privacy law.
Q: How do I tell if audience inflation hit me?
A: Compare audience size on 25 June against 25 July. If a retargeting pool grew more than 20 percent with no traffic increase, that is your answer.
Cause Four: You Are Comparing the Wrong Numbers
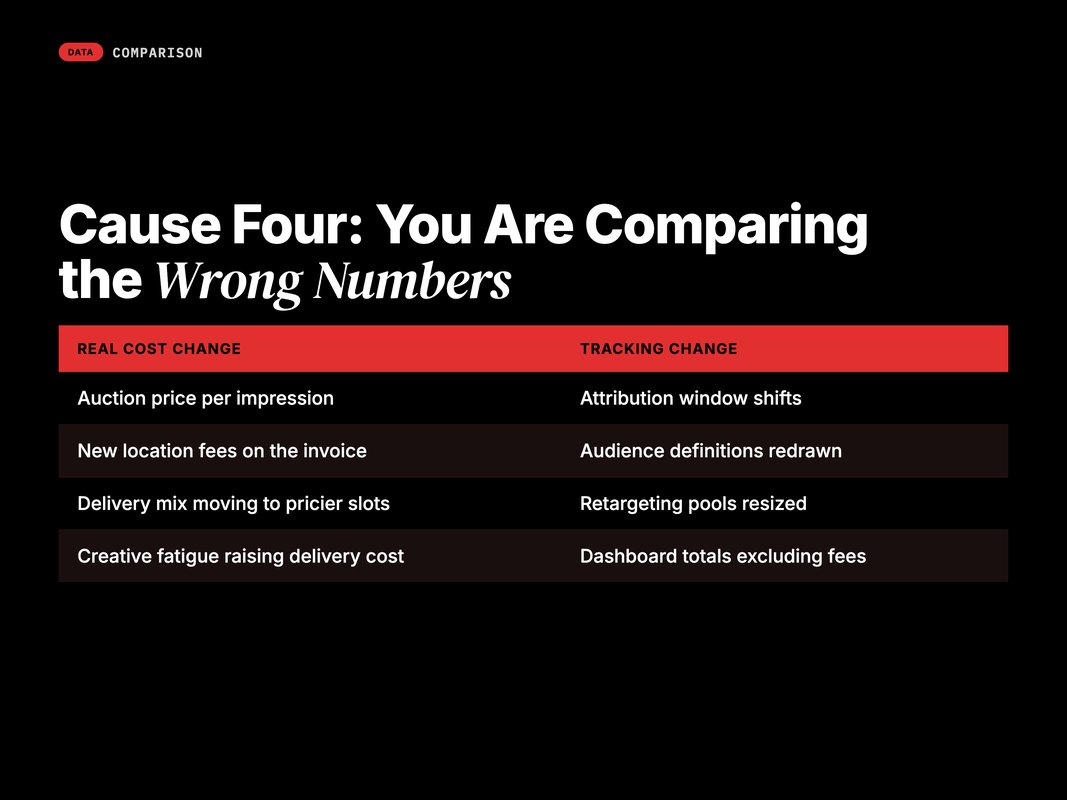
Some of the July jump is not a cost change at all. It is a tracking change.
Windows, audiences and fees all moved in one month. So June and July are no longer like-for-like.
The fix is not complicated. It is just unglamorous.
Rebuild your baseline from invoice spend and back-end revenue. Then compare July to June on that basis. Not on the platform dashboard.
In most accounts the real rise is smaller than the panic. It is also very specific. One country. One placement. One campaign type.
Diagnose Your Own Account in Six Steps
Do not start with strategy. Start with the invoice.
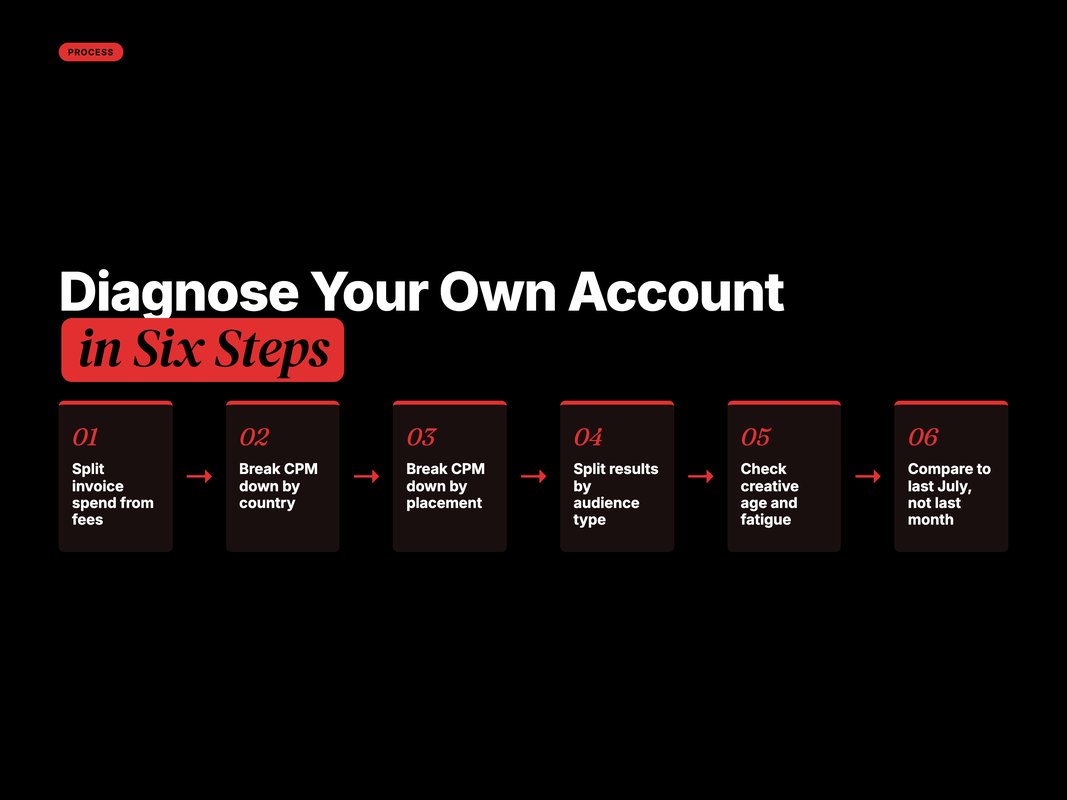
Work the list in order and stop when the gap is explained.
One. Pull the July invoice. Split media spend from fees. Now you know your true spend.
Two. Break CPM by country. If the six fee markets are the outliers, cause two is yours.
Three. Break CPM by placement. Reels, feed and Stories price very differently, and delivery mix shifts on its own.
Four. Split results into cold, warm and retargeting. Look for a warm pool acting like a cold one.
Five. Check creative age. Anything running unchanged for more than six weeks is a likely engagement-tax candidate.
Six. Only now, compare to last July, not to last month. Seasonality is real and June is a soft comparison.
Q: How long should this diagnosis take?
A: Under two hours for a single-market account. Half a day if you run several countries and a big creative library.
What to Actually Do About It
Finding the cause is not the same as fixing it. Here is the short list.
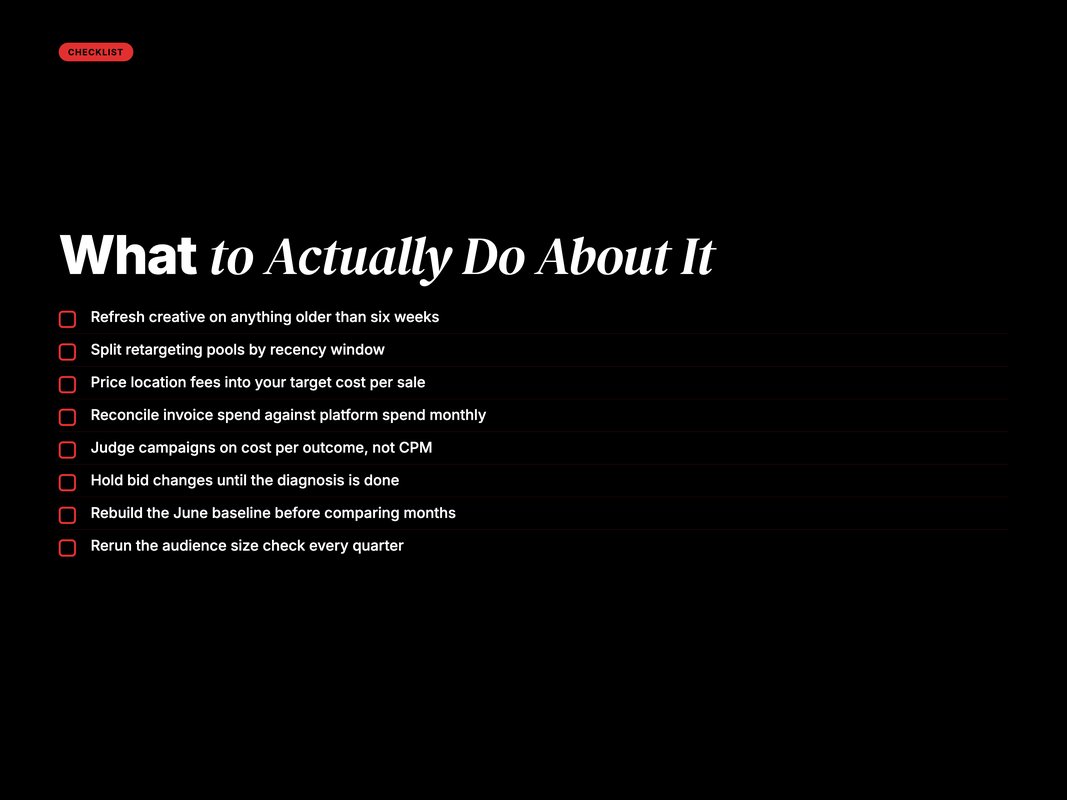
A few of these need a note.
New creative is the strongest lever you own. It moves the engagement side of pricing. It lifts conversion rate too.
Rebuilding audiences matters more than it used to. If your pools grew, split them by recency. A 7-day pool should not share a campaign with a 180-day one.
And fix the tracking once, properly. If invoice spend, platform spend and back-end revenue never match, you will get this fire drill every quarter.
When It Is Worth Bringing in Help
Some cost jumps are a creative problem. Some are a tracking problem. On a dashboard they look the same.
YARD is an AI-first growth marketing agency. We run performance marketing, LLM SEO, AI creative and AI funnels for D2C and B2B brands. A big part of that work is telling real cost moves from report noise.
Our approach to a July spike is dull on purpose. We rebuild the spend baseline from invoices. We cut results by country, placement and audience type. We check creative fatigue before we touch bids.
Only then do we touch the account. Most panic edits make the next month worse. They reset learning on campaigns that were fine.
If your costs moved and nobody knows why, that is a solvable problem. Not a mystery. We can run the audit and hand you the working file. See our platform breakdowns for the deeper cuts, including [internal link: meta-andromeda-algorithm-marketers].
The Short Version
July stacked four changes into one month.
The auction got denser as automation pooled demand. Six European markets picked up a 2 to 5 percent fee. Audience pools inflated after the off-platform data change. And reporting shifted enough that month-on-month comparisons stopped meaning much.
Your job is to work out which of the four is yours. Invoice first. Then country, placement, audience temperature and creative age.
Then act on the one you can control. That is almost always creative and audience structure, not bids.
Costs will keep rising. Double-digit annual price growth is the new planning assumption. Accounts that win are the ones improving conversion rate faster than the auction raises price.
Want that diagnosis run on your account before the next planning cycle? Talk to the YARD team. Bring three months of invoices and platform exports.
FAQ
Q: Why did my Meta ad costs jump in July 2026?
A: Four things stacked in the same month. Auction prices kept climbing. New fees started in six markets. Audience pools grew after the data change. And reports shifted underneath you. Most accounts caught more than one.
Q: How much have Meta ad costs risen in 2026?
A: Meta CPM hit 13.48 dollars on average in 2026. That is about 20 percent above 2025. Meta's own price per ad rose 12 percent year on year in Q2 2026. That was the second straight quarter at that rate.
Q: What are Meta's new location fees?
A: From 1 July 2026 Meta added fees of 2 to 5 percent on ads shown in six markets. Those are the UK, France, Italy, Spain, Austria and Turkey. They sit outside your budget and show up as their own invoice line.
Q: Did the off-platform data change make ads more expensive?
A: Not directly. It grew retargeting pools by letting previously opted-out users back in. Bigger pools shift your mix of cold and warm traffic. Blended CPM and CPA can move either way.
Q: Is a rising CPM always bad?
A: No. CPM is a price, not a result. If CPM rises 15 percent while conversion rate rises 25 percent, you are winning. Judge the account on cost per outcome and contribution margin.
Q: What should I check first in my own account?
A: Open the invoice and split media spend from fees. Then compare CPM by country, by placement and by audience type. Most July jumps show up in those three cuts.
Insights from Our Experts
Explore our latest articles on digital marketing strategies.